
TABLE OF CONTENTS
Preface
Vision & Mission Statement
Core Values
College Goals
Profile
History of MCC
General Information
About our Enrollment
About our Students
About our Programs
About our Employees
About our Finances
About MCC Foundation
About Montgomery County
National Projections
Glossary of Terms
INSTITUTIONAL FACT BOOK
PREFACE
The data in the 2018 Fact Book is for the Academic Year 2018, which encompasses July 1, 2017, through June 30, 2018.
The purpose of the Montgomery Community College Institutional Fact Book is to provide information to support decision making and long-range planning. Having this information available in a readily accessible document as well as on the college web site helps facilitate the college planning process.
The Institutional Fact Book is compiled from data found in college records, North Carolina Community College System records and other outside sources. The data in the 2018 Fact Book is for the Academic Year 2018, which encompasses July 1, 2017, through June 30, 2018. The displays of data are designed to make the information understandable and to provide comparisons where they are logical. It is not intended to be a book of statistics but a book of relative information concerning the college’s students and programs. Every effort has been made to ensure that the information presented is factual. Sources have been provided to support the reliability of the information.
Readers should keep in mind the fluid nature of data, realizing that the Fact Book is a snapshot taken once annually. Any questions or suggestions concerning the content, purpose, or format of the Fact Book should be directed to Gregory Taylor, Coordinator of Institutional Effectiveness at 910-898-9605, taylorg9792@montgomery.edu.
MISSION STATEMENT
MISSION STATEMENT
Montgomery Community College provides life-long educational opportunities that prepare individuals for existing and emerging careers and personal growth.
CORE VALUES
EXCELLENCE
We value . . .
. . . Continuous growth and improvement in every aspect of campus life.
. . . Securing and providing adequate resources so that improvements can be seen and measured.
. . . Freedom to instruct students using various te chniques and the development of methods that will help them achieve their maximum potential.
. . . Personal and professional development of all staff and faculty.
. . . Courage to provide leadership, to take risks, to welcome change, and to persevere.
HONESTY & INTEGRITY
We value . . .
. . . Academic and personal honesty as essential elements in education.
. . . Integrity which binds us to fairness, to truth, and to actions and philosophies that meet the highest ethical standards.
. . . Intellectual honesty and academic freedom, and pledge to foster an environment of trust and responsibility in the learning community.
LEARNING
We value . . .
. . . Learning as a lifetime reward.
. . . Input from learners in the achievement of their goals.
. . . Empowered learning in a high-tech/human-touch environment.
COMMITMENT
We value . . .
. . . Prompt, fair, friendly, courteous, and people-oriented service to our communities, to our stakeholders, and to each other.
. . . A safe and nurturing educational environment.
. . . Opportunities to help make our community, state, nation, and the world a better place in which to live and to work.
RESPECT
We value . . .
. . . Diversity of life experiences and contributions of the students, staff, and faculty that assist with enrichment of the learning community.
. . . The responsibility of treating people with dignity and respect whereby each team member operates unselfishly for the benefit of all stakeholders.
COMMUNICATION
We value . . .
. . . Open and honest dialogue, feedback, and active listening, flowing in all directions.
. . . Teamwork, cooperation, collaboration, innovation, and creative problem-solving.
College Goals
In accomplishing our mission, we commit our resources to serving our community in the successful achievement of its educational goals through the implementation of these strategic college goals:
GOAL 1:
Develop and implement instructional programs and services, in traditional and distance learning formats, consistent with the assessed needs of the constituent groups in the College’s service area and with state, regional and national standards.
GOAL 2:
Provide facilities, technologies, and information services that enhance student learning.
GOAL 3:
Support businesses, industries, and community initiatives through educational services that facilitate economic growth and workforce training.
GOAL 4:
Create a culture for employing and retaining quality faculty and staff to support student success.
GOAL 5:
Develop, and manage human, financial, and infrastructure resources essential to fiscal stability and meeting student and community needs.
GOAL 6:
Consistent with accrediting standards and the College mission, engage in ongoing, systematic institutional planning and evidence-based assessment, resulting in continuous quality improvement and institutional effectiveness.
PROFILE
Academic Year 2018
July 1, 2017 – June 30, 2018
PRESIDENT
Chad A. Bledsoe, PhD
BOARD OF TRUSTEES
Claudia B. Bulthuis, Chairman
Susan Eggleston, Vice Chairman
Gordon Knowles, Secretary
Phil Absher
Gelynda T. Capel
Paula L. Covington
George Gilbreath
Susan Hershberger
Gordon Knowles
Andrea P. Marshall
Samuel Marin
Dr. Johnny L. McKinnon, Jr.
Bill Price
Matthew Monroe, SGA President
LOCATION
Troy, Montgomery County, North Carolina
ACCREDITATION
Montgomery Community College is accredited by the Southern Association of Colleges and Schools Commission on Colleges to award associate degrees, diplomas, and certificates.
TYPE
Public co-educational community college
DEGREES OFFERED
Associate of Applied Science
Associate in Arts, Associate in Science
Associate in General Education
Associate in Engineering
Diplomas, Certificates
CALENDAR
Semester
ANNUAL ENROLLMENT
1,216 Curriculum students 2,345 Non-curriculum students
FULL -TIME FACULTY
32 curriculum
FACULTY CREDENTIALS
Doctorates 3%
Masters 31%
Bachelors 28%
Associate/Others 38%
LIBRARY COLLECTION
20,000 books; 48 periodicals subscriptions
SEMESTER TUITION
2017FA In-state: $76.00/cr hr Out-of-state: $268.00
2018SP In-state: $76.00 /cr hr Out-of-state: $268.00
HISTORY
The State Board of Education issued a charter of establishment to Montgomery Technical Institute on September 7, 1967. As directed by law, eight members were appointed to the Board of Trustees. In November 1967, administrative and teaching personnel were employed. In June 1968, a building on Page Street was occupied as a temporary location of Montgomery Technical Institute. Extension classes were conducted in 19671968, Adult Basic Education and adult high school diploma programs began in October 1968, and full-time curriculum students were accepted in August 1968. The institution’s first students were graduated in June 1969.
On June 3, 1971, the State Board of Education approved Montgomery Technical Institute as a charter technical institution, effective July 1971. In compliance with law, the Governor appointed four additional trustees on December 1, 1971. Responsibility for local control of the College was given to the Board of Trustees, including the President of the Student Government Association (an ex-officio member of the Board of Trustees).
In October 1975, citizens of Montgomery County passed a bond issue authorizing the construction of a new campus of 64,000 square feet on a 149-acre tract of land. The State Board of Education Department of Community Colleges accredited Montgomery Technical Institute on December 7, 1978, and on December 19, 1978. The Commission on Colleges of the Southern Association of Colleges and Schools affirmed its accreditation in 1978.
Montgomery Technical Institute became Montgomery Technical College in 1983 in accordance with legislative and Board approval, and in September 1987, the Board of Trustees and Montgomery County Commissioners voted for the name to be officially changed to Montgomery Community College as authorized by the North Carolina General Assembly. In December 1993, December 2004, and again in July 2014, the Commission on Colleges of the Southern Association of Colleges and Schools reaffirmed the College’s accreditation to offer associate degrees, diplomas, and certificates.
In 1992, local citizens and North Carolina voters approved, through a bond referendum, $2.6 million in matching funds to finance a Business, Industry, Technology Resource Center (BITRC) and the Montgomery County School Board voted in 1994 to transfer approximately four acres of land to the College to be used for the facility. The Center contains 44,800 square feet of space utilized for an electronic library, an interactive classroom to transmit and receive real-time voice, video, and data on the North Carolina Information Highway (NCIH), and classrooms/laboratories. The building serves as a facilitation site for employers to train all levels of staff.
In 2004, Building 500 on the MCC campus underwent a 3,000 square foot renovation that now houses the Criminal Justice Complex. The Complex has classrooms and a physical fitness center, as well as showers, which complement the College’s Criminal Justice and Basic Law Enforcement Training programs.
In 2009, new construction of a building for the Forest Management Technology program added approximately 6,400 square feet to the campus. Classrooms and labs in Building 100 formerly used for the Forestry program were renovated to provide operatories and learning labs for the Dental Assisting program.
The MCC Child Development Center was closed in 2009 due to low enrollment. The former day care space was then renovated to provide a larger space for students and was renamed the Outpost.
In March 2016, the voters of North Carolina approved a $2 billion Connect NC Bond Initiative. Montgomery Community College’s share of the bond funds was approximately $6.3 million. During academic year 2017, renovations to repurpose the Outpost building as MCC’s Workforce Development center began, and the Continuing Education division and NC Works moved into the renovated space early in academic year 2018. Renovations to the old Air Conditioning, Heating, and Refrigeration Technology classroom and lab facilities located in Blair Hall (Building 100) occurred in July and August. This space provided additional enrollment capacity to the wait-listed Gunsmithing program. The Air Conditioning, Heating, and Refrigeration Technology program relocated to leased space known as The Biscoe Center.
Classroom space in Capel Hall (Building 100) underwent renovations during the summer of 2018 to accommodate Montgomery County Early College, which enrolled its first cohort of students in fall 2018.
The MCC campus now includes facilities of approximately 134,400 square feet on 153 acres of land.
GENERAL INFORMATION
MCC is a public, state-supported community college serving Montgomery County, North Carolina. MCC is accredited by the Southern Association of Colleges and Schools Commission on Colleges to award associate degrees, diplomas, and certificates.
ADMISSIONS
The college maintains an “open door” admissions policy; however, some programs have specific entrance requirements.
FINANCIAL AID
MCC has an active financial aid program which assists students with a broad range of financial aid, including:
Federal Grants
Institutional Scholarships
Veteran’s Benefits
Federal Work-Study Program
Vocational Rehabilitation
Foundation Scholarships
EDUCATIONAL SUPPORT SERVICES
Academic Advising
ADA Accessibility Support
Assessment Testing
Virtual Bookstore
Career Assessment
Counseling
Distance Learning Center / Center for Academic and Technology Support
Learning Lab
Library / Learning Resource Center
Student Government Association (SGA)
SGA Clubs and Organizations
Tutoring
GENERAL EDUCATION
The Associate in General Education (AGE) curriculum is designed for individuals wishing to broaden their education, with emphasis on personal interest, growth and development. Course work includes study in the areas of humanities and fine arts, social and behavioral sciences, natural sciences and mathematics, and English composition. Opportunities for the achievement of competence in reading, writing, oral communication, fundamental mathematical skills, and the basic use of computers are provided. All courses in the program are college-level courses.
COLLEGE TRANSFER
The Associate in Arts and the Associate in Science degree is granted for planned programs of study consisting of a minimum of 64-65 semester hours of college transfer courses. Courses are approved for transfer through the Comprehensive Articulation Agreement.
TECHNICAL PROGRAMS
Technical curriculum programs are designed for employment or further education in various technical fields. They are composed of collegiate-level studies that provide theoretical knowledge as well as technical skills. Completion of a technical curriculum program may lead to a certificate, diploma, or an Associate in Applied Science (AAS) degree.
OCCUPATIONAL EDUCATION
MCC offers non-curriculum programs based on the employment needs and interests of the local community. Specialty training is available in areas such as fire services, corrections, and allied health. Occupational education provides training to help students upgrade occupational skills, obtain or maintain certification, and develop new skills.
CAREER AND COLLEGE PROMISE
The Career and College Promise (CCP) program offers motivated North Carolina high school students a clear, focused, and affordable path to future success, allowing them to get a head start on their career and college preparation. Through CCP pathways, qualified North Carolina high school juniors and seniors have the opportunity to enroll – tuition free – in community college courses that lead to certificate, diploma, or degree as well as provide entry-level job skills. Academic credits earned will enable students who continue into postsecondary education after high school graduation to complete a postsecondary credential in less time than would normally be required.
MONTGOMERY COUNTY EARLY COLLEGE HIGH SCHOOL
Montgomery County Early College High School (MCEC) is a collaboration between the Montgomery County School System and Montgomery Community College. MCEC students have the opportunity to earn their high school diploma and an associate degree or two years of transferable college credits in four or five years FOR FREE.
COLLEGE AND CAREER READINESS (FORMERLY BASIC SKILLS)
College and Career Readiness classes are offered for the adult who desires to complete a high school equivalency (GED ® diploma or high school diploma) or to review reading, math, and English skills. Classes are offered both on and off campus. Instruction is individualized and students progress at their own pace. Several businesses and industries sponsor classes for employees.
COMMUNITY SERVICE PROGRAM
Self-enrichment programs provide non-credit courses to individuals for personal interest, development or occupational activities.
SMALL BUSINESS CENTER
The Small Business Center is a resource provided by the State of North Carolina and by the college to help small businesses succeed. The SBC provides free confidential business counseling services, free business seminars and workshops, and free access to vital resources and information. The SBC helps individuals collaborate with business and community leaders and local, state, and federal agencies.
GENERAL INFORMATION
Size of Campus: 153 acres
Number of buildings: 6
Three maintained nature walking trails in the 100 acre Forestry lab, ranging from .3 to 2.0 miles in length
Firing Range for Gunsmithing and BLET programs
AAS degrees: 15
College Transfer degrees: 4
Endowed Scholarships: 86
Named Scholarships: 39
Student Organizations: 14
ABOUT OUR ENROLLMENT
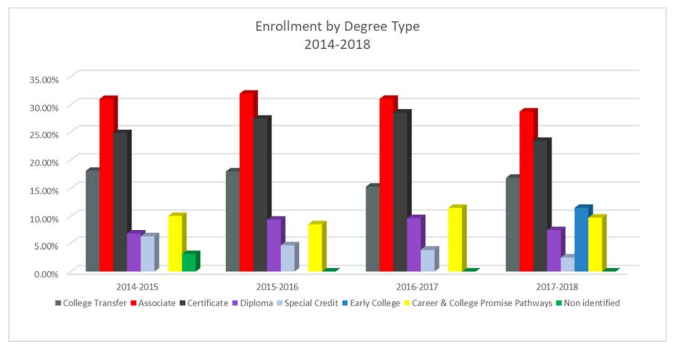
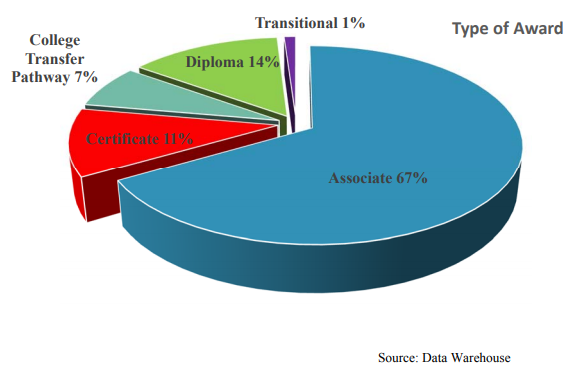
CURRICULUM ENROLLMENT BY DEGREE TYPE
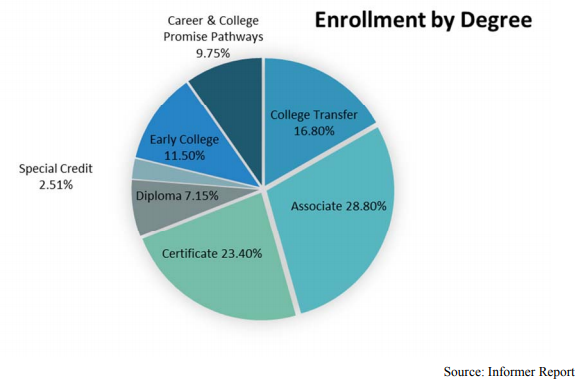
CURRICULUM ENROLLMENT BY DEGREE TYPE
STUDENT BODY 2017-2018
| Fall 2017 Curriculum Students | ||
| Full-Time Students | 35.89% | 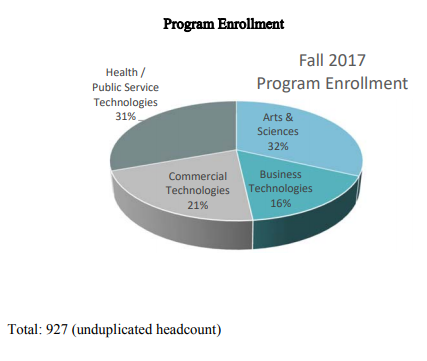 |
| Part-Time Students | 64.11% | |
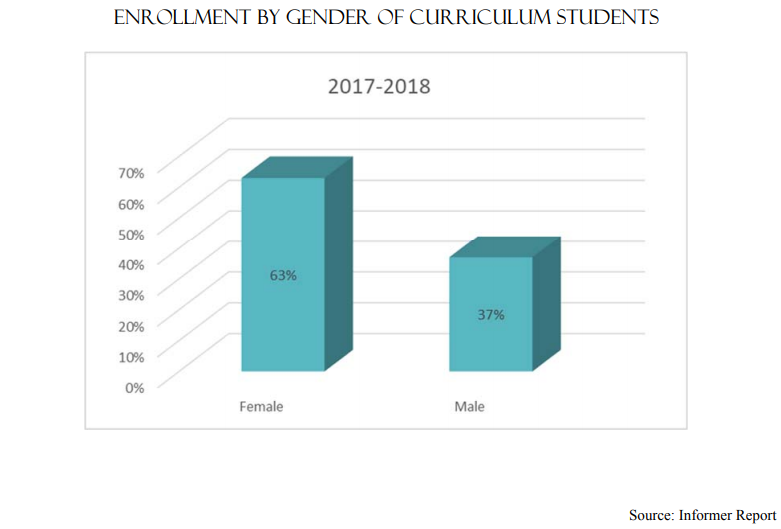
| Female Students | 64.62% | |
| Male Students | 35.38% | |
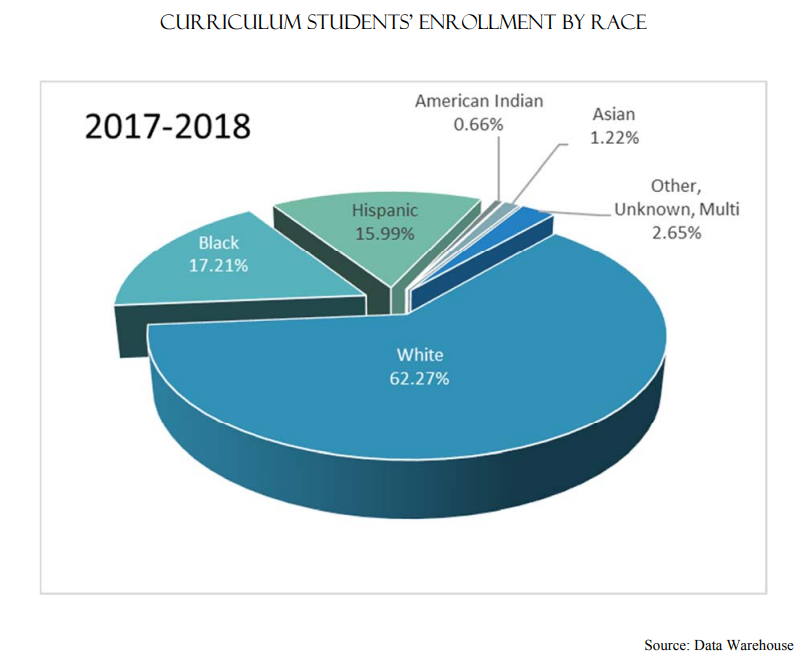
| Minority Students | 39.48% | |
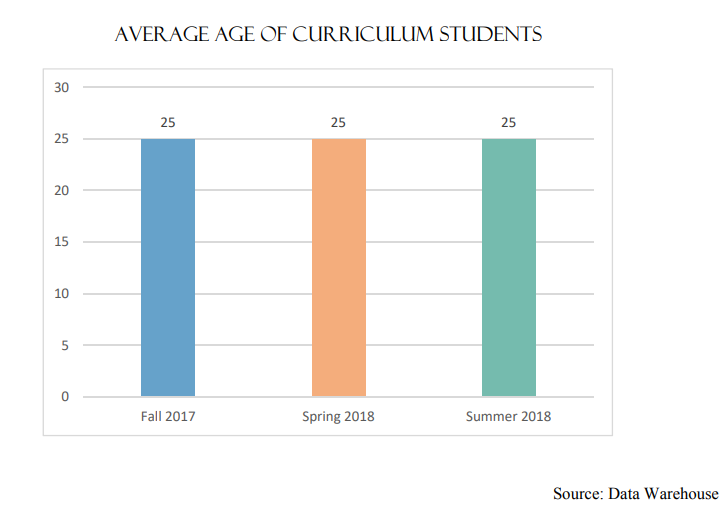
| Average Age of Students | 25 | |
| Employment: | ||
| Full-Time | 13.94% | |
| Part-Time | 20.70% | |
| Unemployed | 65.36% |
| Spring 2018 Curriculum Students | ||
| Full-Time Students | 34.97% | 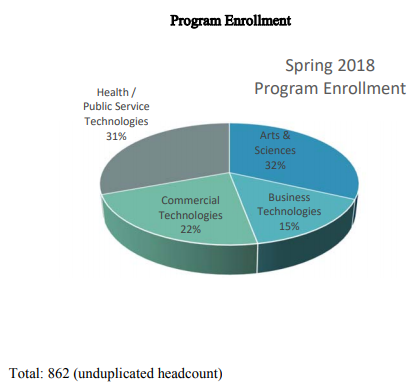 |
| Part-Time Students | 65.03% | |
| Female Students | 62.88% | |
| Male Students | 37.12% | |
| Minority Students | 38.84% | |
| Average Age of Students | 25 | |
| Employment: | ||
| Full-Time | 12.95% | |
| Part-Time | 21.12% | |
| Unemployed | 65.93% |
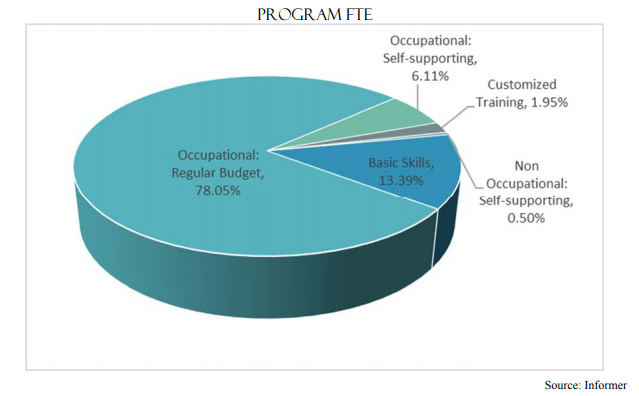
CURRICULUM ANNUAL FTE 2017-2018
CONTINUING EDUCATION 2016-2017
| Fall 2017 Continuing Education | ||
| Students unduplicated | 1197 | 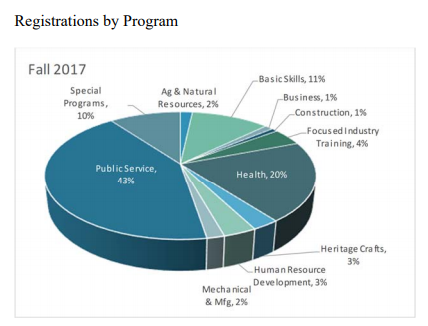 |
| Inmates | 90 | |
| Female Students | 38.9% | |
| Male Students | 61.1% | |
| Minority Students | 21.4% | |
| Average Age of Students | 43 |
| Spring 2018 Continuing Education | ||
| Students | 1076 | 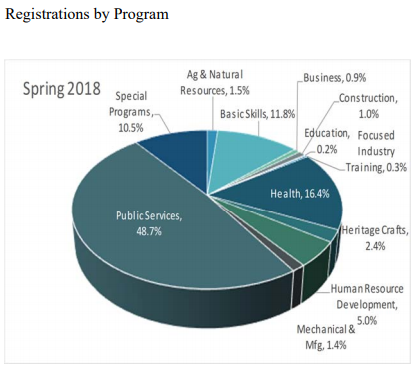 |
| Inmates | 87 | |
| Female Students | 34.52% | |
| Male Students | 65.48% | |
| Minority Students | 21.67% | |
| Average Age of Students | 42 |
Back to Table of Contents
ABOUT OUR STUDENTS
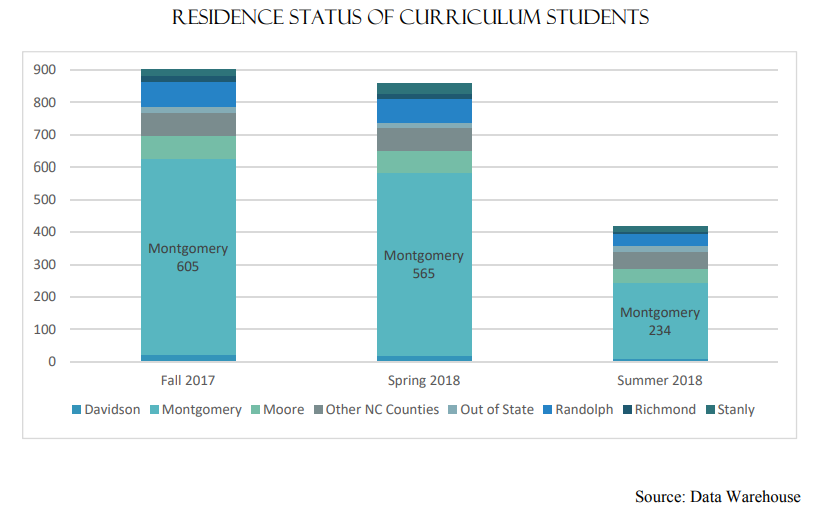

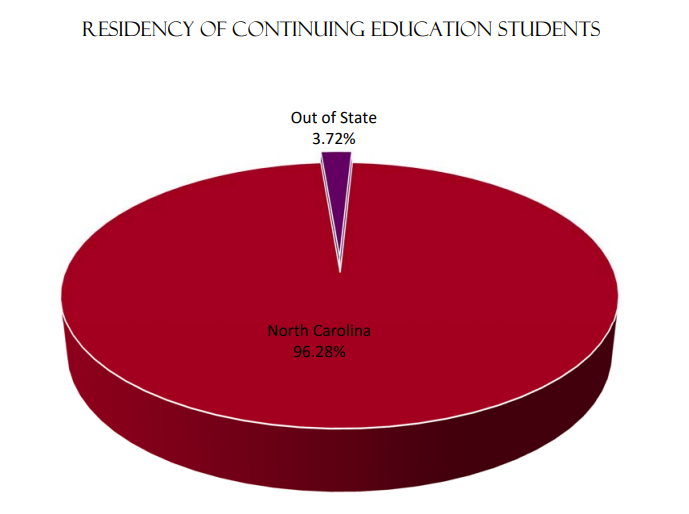
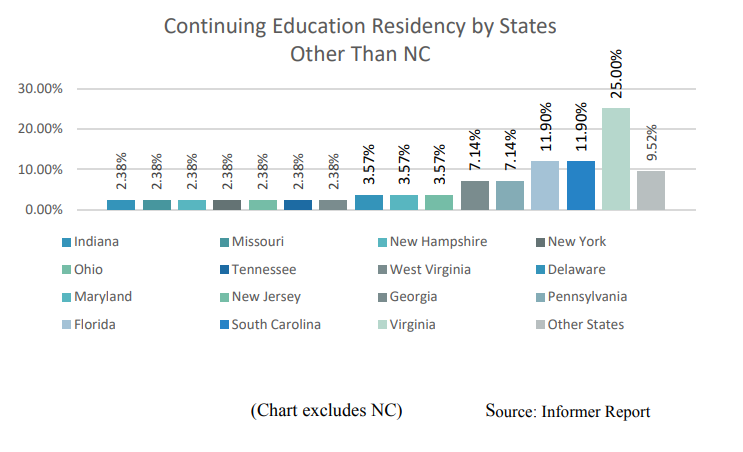
Montgomery Community College Continuing Education students are residents in 45 out of 100 counties in North Carolina,
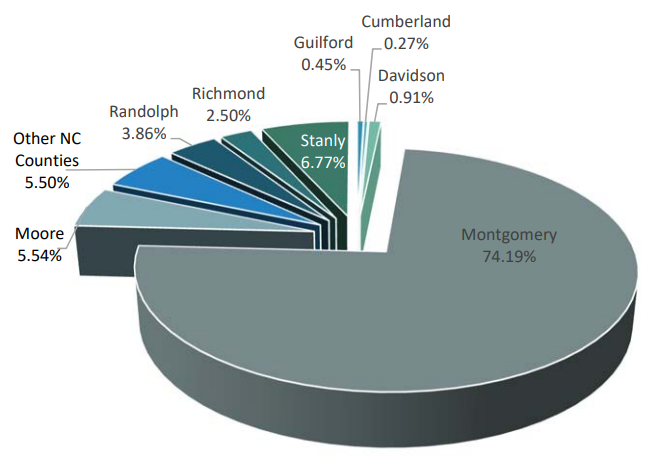
and 24 out of 50 states.
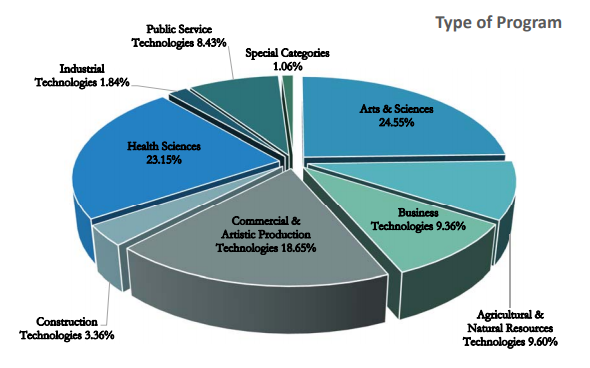
ABOUT OUR PROGRAMS
CURRICULUM PROGRAMS OF STUDY
ARTS & SCIENCES
COLLEGE TRANSFER
MCC offers college transfer programs through the AA and AS degrees. The AA and the AS programs are part of the Comprehensive Articulation Agreement (CAA). The CAA addresses the transfer of students between institutions in the N. C. Community College System and the constituent institutions of the University of North Carolina. Many independent colleges and universities endorse the CAA.
GENERAL EDUCATION
The Associate in General Education (AGE) curriculum is designed for individuals wishing to broaden their education, with emphasis on personal interest, growth and development. Opportunities for the achievement of competence in reading, writing, oral communication, fundamental mathematical skills, and the basic use of computers are provided. All courses in the program are college-level courses. The program is not principally designed for college transfer.
| Program | Associate Degree | Diploma | Certificate |
| Associate in Arts (college transfer) | X | ||
| Associate in Engineering | X | ||
| Associate in Fine Arts | X | ||
| Associate in General Education | X | ||
| Associate in Science (college transfer) | X |
TECHNICAL CURRICULA
BUSINESS TECHNOLOGIES
Business Technologies programs offer training in traditional business and support areas, and in business-related fields, including computer and related technology programs. All programs include appropriate technology components and other essential workplace skills, such as communication, critical thinking, problem-solving, and team building.
| Program | Associate Degree | Diploma | Certificate |
| Accounting | X | ||
| Business Administration | X | X | X |
| Hunting & Shooting Sports Management | X | X | |
| Information Technology | X | X | |
| Medical Office Administration | X | X | X |
| Office Administration | X | X | X |
COMMERCIAL TECHNOLOGIES
Commercial Technologies programs prepare individuals to work in occupations whose focus is very hands on, whether of an artistic or commercial nature, and provide opportunities for specialized training of individuals to work in a trade or artistic related career.
| Program | Associate Degree | Diploma | Certificate |
| Air Conditioning, Heating, & Refrigeration Technology | X | X | X |
| Electrical Systems Technology | X | X | X |
| Forest Management Technology | X | X | |
| Gunsmithing | X | X | X |
| Industrial Systems Technology | X | X | X |
| Metal Engraving | X | ||
| Professional Crafts: Clay | X | ||
| Taxidermy | X | X | |
| Welding | X | X |
HEALTH/PUBLIC SERVICES TECHNOLOGIES
Health Sciences programs prepare individuals to work closely with professionals in providing health care services. The programs are designed to provide a base in general education and specific training in a variety of health care settings. Public Service Technologies programs are designed to prepare people for employment in the public and private sector in service-related careers.
| Program | Associate Degree | Diploma | Certificate |
| Basic Law Enforcement Training | X | ||
| Criminal Justice Technology | X | X (CCP) | X |
| Dental Assisting | X | ||
| Early Childhood Education | X | X | X |
| Foodservice Technology | X (SCI) | ||
| Human Services Technology | X | X | X |
| Human Services Technology: Developmental Disabilities Concentration | X | X | X |
| Medical Assisting | X | X | |
| Nurse Aide | X | X | |
| Phlebotomy | X | ||
| Practical Nursing | X |
Source: MCC Website
NEW PROGRAMS APPROVED IN AY18 TO BE OFFERED IN AY19
| Program | Associate Degree | Diploma | Certificate |
| Automotive Systems Technology (1+1) | X | X | |
| Computer-Integrated Machining (1+1) | X | ||
| Culinary (1+1) | X | ||
| Facility Maintenance Technology | X | X | X |
| Mechatronics Engineering Technology | X | X | X |
| Sustainable Agriculture | X | X | X |
STUDENT ENROLLMENT BY CURRICULUM 2013-2018
| 2013-14 | 2014-15 | 2015-16 | 2016-17 | 2017-2018 | |
| Arts & Sciences | |||||
| Associate in Arts (college transfer) | 100 | 72 | 65 | 59 | 106 |
| Associate in Science (college transfer) | 15 | 19 | 14 | 22 | 86 |
| Associate in Elementary Education | 3 | 1 | 1 | ||
| Associate in Engineering | 33 | ||||
| Associate in General Education | 130 | 97 | 108 | 91 | 80 |
| Business Technologies | |||||
| Accounting | 6 | 4 | 2 | ||
| Business Administration | 85 | 81 | 111 | 72 | 66 |
| Hunting and Shooting Sports Management | 20 | 12 | 11 | 6 | 5 |
| Information Technology | 106 | 83 | 93 | 79 | 60 |
| Medical Office Administration | 7 | ||||
| Office Administration | 58 | 46 | 42 | 96 | 52 |
| Office Administration: Legal Concentration | 4 | 1 | |||
| Commercial Technologies | |||||
| Air Conditioning, Heating, & Refrigeration Technology | 12 | 5 | 9 | 14 | 12 |
| Electrical Systems Technology | 26 | 31 | 21 | 20 | 15 |
| Forest Management Technology | 47 | 46 | 46 | 58 | 55 |
| Gunsmithing | 76 | 68 | 72 | 74 | 75 |
| Industrial Maintenance Technology | 6 | 16 | |||
| Metal Engraving | 4 | 2 | 2 | 3 | 3 |
| Professional Crafts: Clay | 20 | 11 | 3 | ||
| Taxidermy | 21 | 17 | 23 | 18 | 7 |
| Welding | 7 | ||||
| Health/Public Service Technologies | |||||
| Basic Law Enforcement Training | 16 | 11 | 14 | 12 | |
| Criminal Justice Technology | 45 | 50 | 42 | 39 | 39 |
| Dental Assisting | 16 | 13 | 17 | 16 | 19 |
| Early Childhood Education | 45 | 38 | 39 | 32 | 33 |
| Foodservice Technology | 23 | 28 | 28 | 23 | 20 |
| Human Services Technology | 98 | 68 | 95 | 90 | 70 |
| Medical Assisting | 49 | 49 | 37 | 50 | 52 |
| Nurse Aide | 12 | 3 | |||
| Phlebotomy | 19 | 8 | |||
| Practical Nursing | 58 | 53 | 56 | 62 | 49 |
| Special Credit | 107 | 50 | 49 | 44 | 35 |
| Career & College Promise Pathways | 126 | 189 | 135 | 169 | 128 |
| 1300 | 1150 | 1132 | 1188 | 1153 | |
| Students may be enrolled in multiple academic programs during a term or academic year. |
Source: Data Warehouse Custom Report (Student Enrollment by Curriculum By Year)
CAREER & COLLEGE PROMISE
| Enrollment by Program | ||||||||||||
| Career & College Promise | ||||||||||||
| Program Name | Fall 2014 | Spring 2015 | Summer 2015 *No CCP Enrollment | Fall 2015 | Spring 2016 | Summer 2016 | Fall 2016 | Spring 2017 | Summer 2017 | Fall 2017 | Spring 2018 | Sumer 2018 |
| Forest Management HS CCP Certificate | 1 | |||||||||||
| Accounting HS CCP Certificate | 3 | 2 | ||||||||||
| Business Administration HS CCP CertificateComputer Info Technology HS CCP CertificateProfessional Office Administration Certificate | 6 | 7 | 8 | 15 | 1 | 3 | 1 | 3 | 1 | |||
| 42 | 41 | 61 | 29 | 2 | ||||||||
| 3 | 1 | |||||||||||
| Microsoft Applications CCP HS Certificate | 13 | 34 | 4 | 5 | 1 | 1 | ||||||
| Information Technology HS CCP Certificate | 29 | 1 | 3 | 13 | 22 | 3 | ||||||
| Hunting and Shooting Sports Mgmt HS CCP Certificate | 1 | |||||||||||
| Fish Taxidermy Certificate HS CCP | 1 | |||||||||||
| AC, Heating & Refrigeration Technology HS CCP Certificate | 1 | 1 | 1 | |||||||||
| Electrical Systems Technology HS CCP Certificate | 5 | 3 | 1 | |||||||||
| Human Services Technology HS CCP Certificate | 26 | 10 | 26 | 28 | 10 | 21 | 17 | 23 | 3 | |||
| Medical Assisting HS CCP Certificate | 21 | 11 | 6 | 1 | 2 | 1 | ||||||
| Phlebotomy HS CCP Certificate | 3 | 1 | 3 | 1 | 1 | |||||||
| Nurse Aide HS CCP Certificate | 1 | |||||||||||
| Industrial Systems Technology HS CCP Certificate | 2 | 2 | 3 | |||||||||
| Welding Basic Certificate HS CCP | 1 | 1 | 2 | |||||||||
| Criminal Justice Certificate HS CCP | 12 | 9 | 9 | 4 | 1 | |||||||
| Criminal Justice Technology Diploma | 1 | 1 | 5 | 1 | 3 | 1 | ||||||
| Early Childhood Education Certificate HS CCP | 1 | 1 | 1 | 1 | ||||||||
| Pathways Humanities & Social Sciences | 7 | |||||||||||
| Pathways Business & Economics | 2 | |||||||||||
| Pathways Associate in Art | 29 | 56 | 50 | 43 | 4 | 31 | 23 | 42 | 33 | 13 | ||
| Pathway Associate in Science | 67 | 61 | 37 | 43 | 6 | 21 | 20 | 15 | 16 | 27 | 23 | |
| NOTE: CCP Students can be enrolled in more than one program per semester. |
Source: Informer Report (CU Enrolled by Program)
| CCP Statistics | ||||||||||||
| Fall 2014 | Spring 2015 | Summer 2015 | Fall 2015 | Spring 2016 | Summer 2016 | Fall 2016 | Spring 2017 | Summer 2017 | Fall 2017 | Spring 2018 | Summer 2018 | |
| Approximate Number of Students | 228 | 127 | 204 | 75 | 8 | 182 | 219 | 59 | 103 | 121 | 55 | |
| Enrolled in X Classes | 437 | 228 | 361 | 130 | 8 | 317 | 408 | 77 | 404 | 462 | 104 | |
| From East Montgomery HS | 134 | 60 | 130 | 37 | 6 | 153 | 239 | 58 | 60 | 63 | 33 | |
| From West Montgomery HS | 85 | 60 | 64 | 34 | 1 | 142 | 150 | 15 | 28 | 44 | 17 | |
| From North Moore HS | 1 | |||||||||||
| From Wescare Academy | 5 | 5 | 5 | 3 | 1 | 8 | 7 | |||||
| From Home School | 3 | 2 | 4 | 1 | 13 | 7 | 4 | 8 | 7 | 3 | ||
| From Other | 1 | 1 | 7 | 7 | 1 |
Source: Informer Report (CCP Enrollment Details by Term)
MONTGOMERY COUNTY EARLY COLLEGE
| Enrollment By Semester (Duplicated Count) | |||
| 2017 Fall | 2018 Spring | 2018 Summer | |
| Early College Students | 125 | 108 | 58 |
| Early College Enrollment by Program of Study (Unduplicated) | 2017-2018 |
| Associate in Arts | 40 |
| Associate in science | 54 |
| Associate in Engineering | 28 |
| AAS Industrial Systems Technology | 3 |
| Total | 125 |
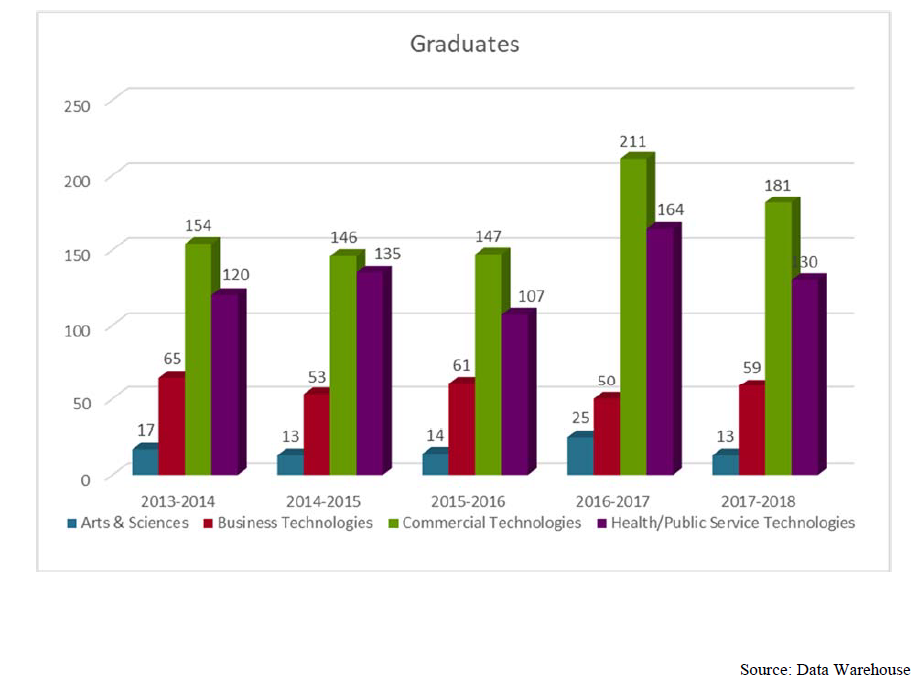
CURRICULUM PROGRAM GRADUATES 2013-2018
| 2013-2014 | 2014-2015 | 2015-2016 | 2016-2017 | 2017-2018 | Dept.Total | |
| Arts & Sciences | 17 | 13 | 14 | 25 | 13 | 84 |
| Business Technologies | 65 | 53 | 61 | 50 | 59 | 275 |
| Commercial Technologies | 154 | 146 | 147 | 211 | 181 | 795 |
| Health/Public Service Technologies | 120 | 135 | 107 | 164 | 130 | 642 |
| TOTAL | 356 | 347 | 329 | 450 | 383 | 1865 |
NC LABOR MARKET PROJECTIONS AS RELATED TO PROGRAMS
| 2014 Employment | 2024EmploymentProjections | Percent Change | |
| Programs / Occupations | NC | NC | NC |
| Arts & Sciences | |||
| College Transfer Programs | |||
| Business Technologies | |||
| Accounting | |||
| Accountants and Auditors | 34,518 | 40,061 | 0.16 |
| Bill and Account Collectors | 10,789 | 10,875 | 0.01 |
| Billing and Posting Clerks and Machine Operators | 14,924 | 17,501 | 0.17 |
| Bookkeeping, Accounting, and Auditing Clerks | 48,261 | 46,641 | -0.03 |
| Budget Analysts | 1,032 | 1,104 | 0.07 |
| Credit Authorizers, Checkers, and Clerks | 891 | 883 | -0.01 |
| Financial Analysts | 7,748 | 9,512 | 0.23 |
| Financial Examiners | 1,262 | 1,587 | 0.26 |
| Financial Specialists, All Other | 3,488 | 3,945 | 0.13 |
| New Accounts Clerks | 2,298 | 2,458 | 0.07 |
| Payroll and Timekeeping Clerks | 4,825 | 4,921 | 0.02 |
| Personal Financial Advisors | 7,047 | 9,812 | 0.39 |
| Statistical Assistants | 356 | 345 | -0.03 |
| Tax Preparers | 2,490 | 2,527 | 0.01 |
| Business Administration | |||
| Administrative Services Managers | 5,308 | 6,109 | 0.15 |
| Business Operations Specialists, All Other | 30,676 | 34,617 | 0.13 |
| First-line Supervisors of Office and Administrative Support Workers | 40,048 | 46,537 | 0.16 |
| General and Operations Managers | 54,833 | 62,744 | 0.14 |
| Managers, All Others | 24,123 | 27,227 | 0.13 |
| Marketing Managers | 5,645 | 7,029 | 0.25 |
| Hunting & Shooting Sports Management | |||
| Retail Salespersons | 143,798 | 163,878 | 0.14 |
| Sales and Related Workers, All Other | 38,638 | 43,465 | 0.12 |
| Sales Managers | 8,152 | 9,250 | 0.13 |
| Sales Representatives, Services, All Other | 21,979 | 25,011 | 0.14 |
| Wholesale and Retail Buyers, Except Farm Products | 3,529 | 4,043 | 0.15 |
| Information Technology | |||
| Computer Hardware Engineers | 1,316 | 1,427 | 0.08 |
| Computer and Information Scientists, Research | 315 | 373 | 0.18 |
| Computer Programmers | 7,906 | 8,061 | 0.02 |
| Computer Software Developers Applications | 22,024 | 26,712 | 0.21 |
| Computer Software Developers, Systems Software | 10,881 | 12,724 | 0.17 |
| Arts & Sciences | |||
| College Transfer Programs | |||
| Business Technologies | |||
| Information Technology | |||
| Computer Network Specialists | 6,563 | 7,357 | 0.12 |
| Computer User Support Specialists | 19,824 | 23,125 | 0.17 |
| Computer Systems Analysts | 17,268 | 22,258 | 0.29 |
| Computer, Automated Teller & Office Mach. Repairer | 4,209 | 4,583 | 0.09 |
| Computer and Information Systems Managers | 12,267 | 15,419 | 0.26 |
| Office Administration | |||
| Computer Operators | 1,805 | 1,604 | -0.11 |
| Correspondence Clerks | 98 | 91 | -0.07 |
| Data Entry Keyers | 6,129 | 6,043 | -0.01 |
| Desktop Publishers | 231 | 178 | -0.23 |
| Executive Secretaries & Administrative Assistants | 24,428 | 24,084 | -0.01 |
| File Clerks | 2,395 | 2,395 | 0.00 |
| Information and Record Clerks, All Other | 3,713 | 3,846 | 0.04 |
| Office and Administrative Support Workers, All Other | 7,471 | 8,688 | 0.16 |
| Office Clerks, General | 80,032 | 86,565 | 0.08 |
| Receptionists & Information Clerks | 28,584 | 33,395 | 0.17 |
| Secretaries and Administrative Assistants, Except Legal, Medical, and Executive | 63,987 | 69,219 | 0.08 |
| Word Processors and Typists | 783 | 675 | -0.14 |
| Commercial Technologies | |||
| Air Conditioning, Heating & Refrigeration Technology | |||
| Heating, Air Conditioning, and Refrigeration Mechanics and Installers | 12,168 | 14,146 | 0.16 |
| Electrical SystemsTechnology / Industrial Systems Technology | |||
| Electrical and Electronic Engineering Technicians | 3,439 | 3,613 | 0.05 |
| Electrical and Electronics Drafters | 697 | 789 | 0.13 |
| Electrical and Electronics Repairers, Commercial and Industrial Equipment | 2,586 | 2,711 | 0.05 |
| Telecommunications Equipment Installers and Repairers, Except Line Installers | 5,625 | 5,587 | -0.01 |
| Maintenance and Repair Workers, General | 42,120 | 46,612 | 0.11 |
| Electrical and Electronic Equipment Mechanics, Installers and Repairers | 18,397 | 19,229 | 0.05 |
| Industrial Engineering Technicians | 1,672 | 1,696 | 0.01 |
| Industrial Machinery Mechanics | 9,920 | 11,925 | 0.20 |
| Commercial Technologies | |||
| Forest Management Technology | |||
| Environmental Engineering Technicians | 371 | 412 | 0.11 |
| Fallers | 716 | 646 | -0.10 |
| Forest and Conservation Technicians | 525 | 511 | -0.03 |
| Forest, Conservation and Logging Workers | 2,817 | 2,845 | 0.01 |
| Foresters | 354 | 370 | 0.05 |
| Logging Equipment Operators | 1,911 | 2,017 | 0.06 |
| Surveying and Mapping Technicians | 2,709 | 2,633 | -0.03 |
| Tree Trimmers and Pruners | 2,205 | 2,442 | 0.11 |
| Gunsmithing | |||
| Etchers and Engravers | 141 | 148 | 0.05 |
| Lathe and Turning Machine Tool Setters, Operators | 1,430 | 1,177 | -0.18 |
| Machinists | 11,729 | 13,578 | 0.16 |
| Tool and Die Makers | 1,655 | 1,550 | -0.06 |
| Woodworkers, All Other | 159 | 169 | 0.06 |
| Metal Engraving | |||
| Etchers and Engravers | 141 | 148 | 0.05 |
| Taxidermy | |||
| Commercial and Industrial Designers | 962 | 1,045 | 0.09 |
| Fine Artists, Including Painters, Sculptors | 951 | 1,066 | 0.12 |
| Set and Exhibit Designers | 221 | 249 | 0.13 |
| Health/Public Service Technologies | |||
| Criminal Justice Technology / BLET | |||
| Bailiffs | 308 | 337 | 0.09 |
| Correctional Officers and Jailers | 18,010 | 17,954 | 0.00 |
| Detectives and Criminal Investigators | 3,493 | 3,681 | 0.05 |
| First-line Super. /Man. Of Correctional Officers | 1,565 | 1,604 | 0.02 |
| First-line Super. /Man. Of Police & Detectives | 4,054 | 4,341 | 0.07 |
| Police and Sheriff’s Patrol Officers | 20,004 | 21,579 | 0.08 |
| Security Guards | 27,655 | 29,928 | 0.08 |
| Probation Officers & Correctional Treatment Spec. | 3,040 | 2,936 | -0.03 |
| Dental Assisting | |||
| Dental Assistants | 9,078 | 11,373 | 0.25 |
| Early Childhood Associate / Infant Toddler Care / School-Age Care | |||
| Child Care Workers | 41,364 | 46,349 | 0.12 |
| Preschool Teachers, Except Special Education | 10,217 | 11,485 | 0.12 |
| Foodservice Technology | |||
| Combined Food Preparation and Serving Workers | 139,910 | 169,226 | 0.21 |
| Cooks, Fast Food | 5,564 | 5,145 | -0.08 |
| Cooks, Institution and Cafeteria | 8,861 | 10,211 | 0.15 |
| Cooks, Restaurant | 36,035 | 45,128 | 0.25 |
| Cooks, Short Order | 3,871 | 4,039 | 0.04 |
| Supervisors of Food Preparation and Serving Workers | 35,452 | 42,262 | 0.19 |
| Food Preparation & Serving Related Workers, Other | 36,672 | 40,912 | 0.12 |
| Food Preparation Workers | 20,935 | 23,819 | 0.14 |
| Food Service Managers | 7,694 | 8,770 | 0.14 |
| Human Services Technology / HST: Developmental Disabilities | |||
| Child, Family, and School Social Workers | 9,922 | 10,871 | 0.10 |
| Community & Social Service Specialists, All Other | 2,814 | 3,080 | 0.09 |
| Mental Health and Substance Abuse Social Workers | 3,635 | 4,631 | 0.27 |
| Mental Health Counselors | 3,824 | 4,861 | 0.27 |
| Rehabilitation Counselors | 3,263 | 3,734 | 0.14 |
| Social and Community Service Managers | 2,405 | 2,744 | 0.14 |
| Social and Human Service Assistants | 8,826 | 10,264 | 0.16 |
| Social Workers, All Other | 1,191 | 1,180 | -0.01 |
| Substance Abuse & Behavioral Disorder Counselors | 1,760 | 2,227 | 0.27 |
| Medical Assisting | |||
| Health Technologists and Technicians, All Other | 5,401 | 6,907 | 0.28 |
| Medical Assistants | 14,317 | 17,941 | 0.25 |
| Medical Records and Health Information Technicians | 5,159 | 6,197 | 0.20 |
| Medical Secretaries | 10,850 | 13,375 | 0.23 |
| Nurse Aide | |||
| Home Health Aides | 48,523 | 65,371 | 0.35 |
| Nursing Assistant | 53,281 | 66,806 | 0.25 |
| Personal Care and Service Workers, All Other | 80,430 | 93,138 | 0.16 |
| Phlebotomist | |||
| Phlebotomists | 4,667 | 6,214 | 0.33 |
| Practical Nursing | |||
| Licensed Practical and Licensed Vocational Nurses | 15,865 | 18,673 | 0.18 |
| Continuing Education | |||
| Healthcare Support Workers, All Other | 3,985 | 4,860 | 0.22 |
| Home Health Aides | 48,523 | 65,371 | 0.35 |
| Orderlies | 1,068 | 1,291 | 0.21 |
| Health Technologists and Technicians, All Other | 5,401 | 6,907 | 0.28 |
| Personal Care and Service Workers, All Other | 80,430 | 93,138 | 0.16 |
| Emergency Medical Technicians and Paramedics | 10,176 | 12,312 | 0.21 |
| Police, Fire, & Ambulance Dispatchers | 3,534 | 3,486 | -0.01 |
| Continuing Education | |||
| Computer-Controlled Machine Tool Operators | 5,413 | 6,723 | 0.24 |
| Probation Officers & Correctional Treatment Spec. | 3,040 | 2,936 | -0.03 |
| Security Guards | 27,655 | 29,928 | 0.08 |
| Correctional Officers and Jailers | 18,010 | 17,954 | 0.00 |
| Electrical and Electronic Engineering Technicians | 3,439 | 3,613 | 0.05 |
| Electrical and Electronic Equipment Mechanics, Installers and Repairers | 18,397 | 19,229 | 0.05 |
| Welders, Cutters, Solderers, and Brazers | 8,744 | 9,424 | 0.08 |
| Welding, Soldering, and Brazing Machine Setters | 1,578 | 1,363 | -0.14 |
| Structural Iron & Steel Workers | 1,517 | 1,673 | 0.10 |
| Structural Metal Fabricators and Fitters | 2,144 | 2,273 | 0.06 |
| Sheet Metal Workers | 3,920 | 4,305 | 0.10 |
| Appraisers and Assessors of Real Estate | 1,946 | 2,212 | 0.14 |
| Real Estate Brokers | 12,703 | 14,729 | 0.16 |
| Real Estate Sales Agents | 8,889 | 11,358 | 0.28 |
| Property, Real Estate & Community Assoc. Manager | 5,076 | 5,895 | 0.16 |
| Automotive Service Technicians and Mechanics | 26,126 | 28,672 | 0.10 |
| Bus & Truck Mechanics & Diesel Engine Specialists | 7,440 | 8,453 | 0.14 |
Source: NC Department of Commerce, Occupational Projections
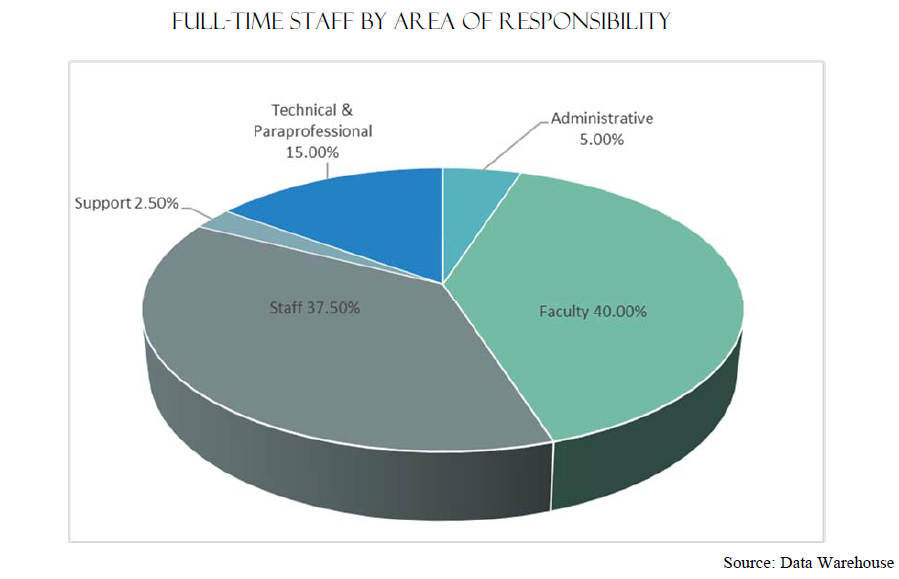
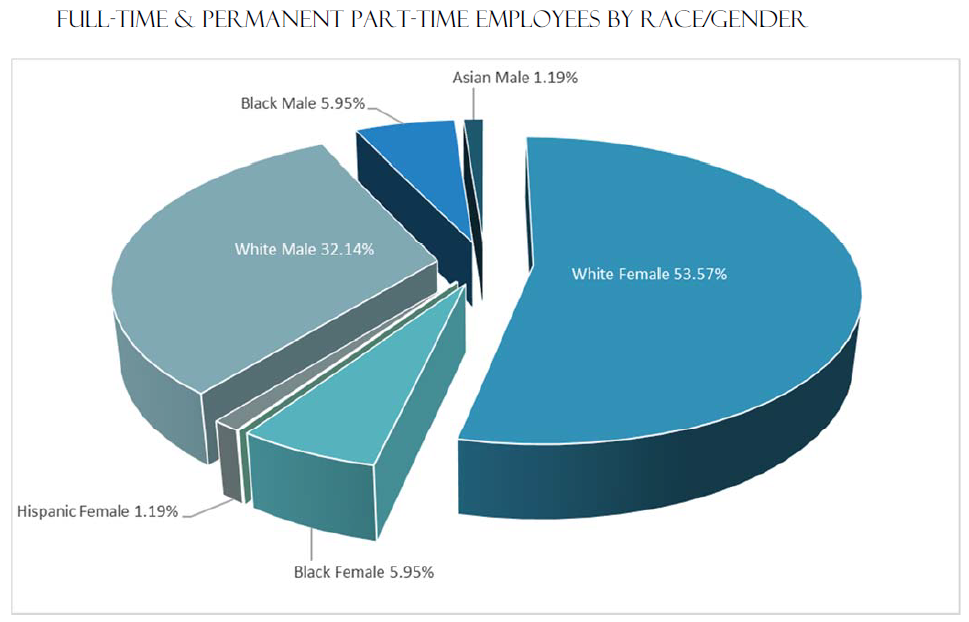
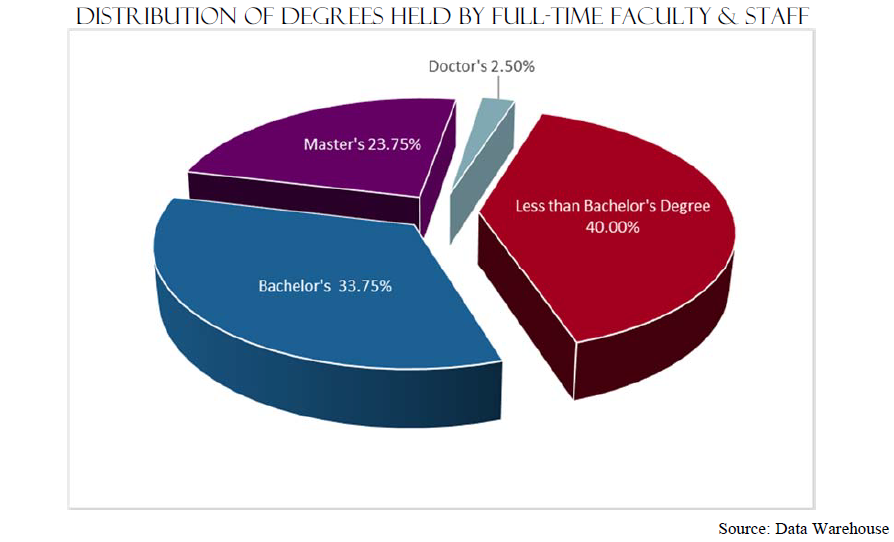
ABOUT OUR EMPLOYEES
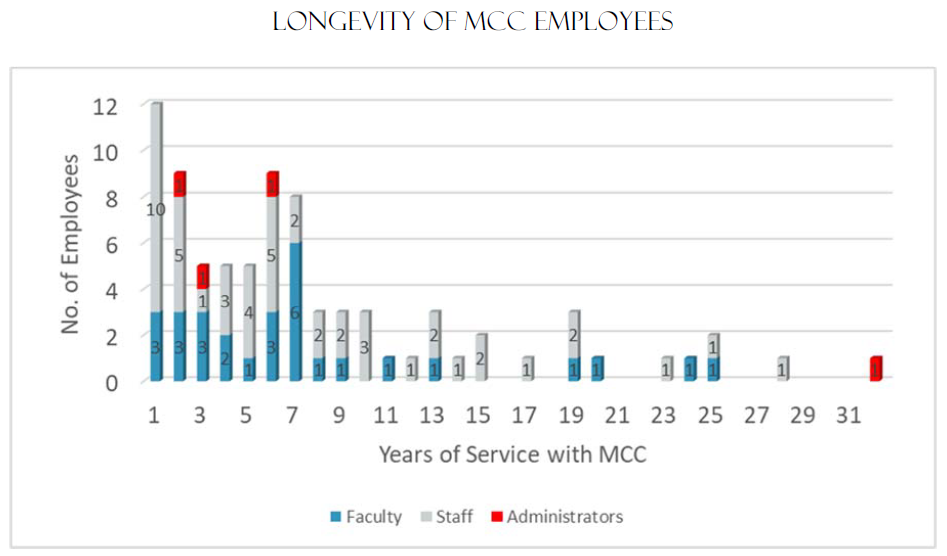
Chart represents employees’ total years at MCC; some years are not consecutive. Source: Data Warehouse
ABOUT OUR FINANCES
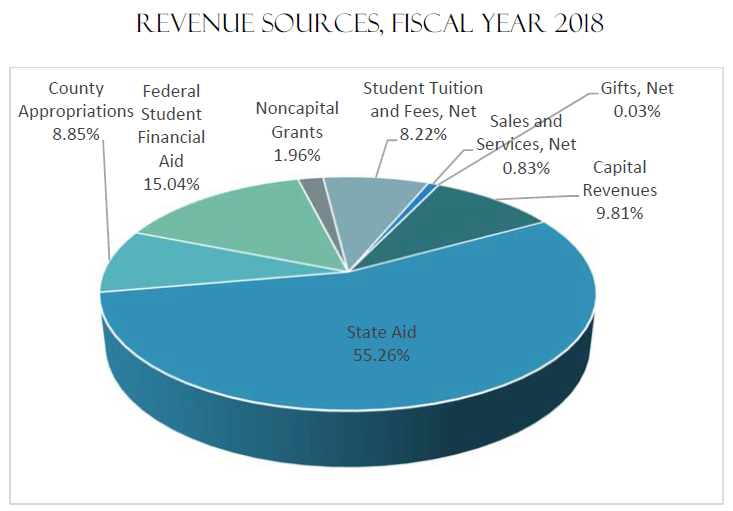
Source: VP of Administrative Services
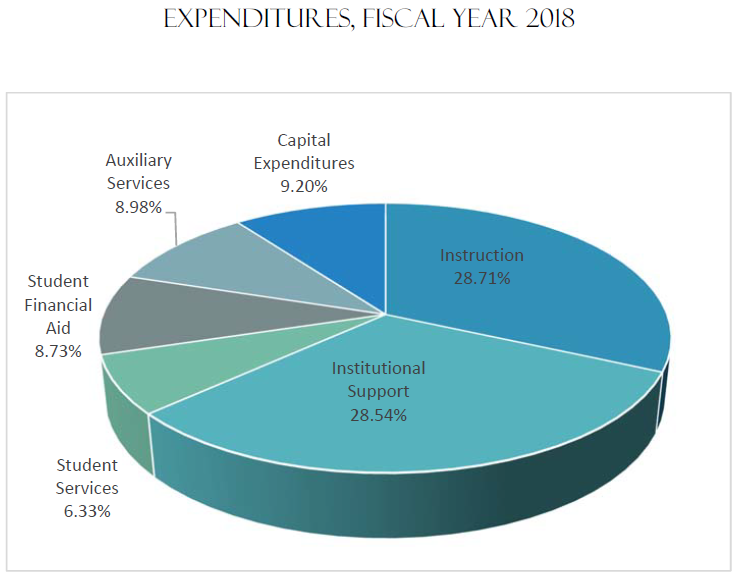
Source: VP of Administrative Services
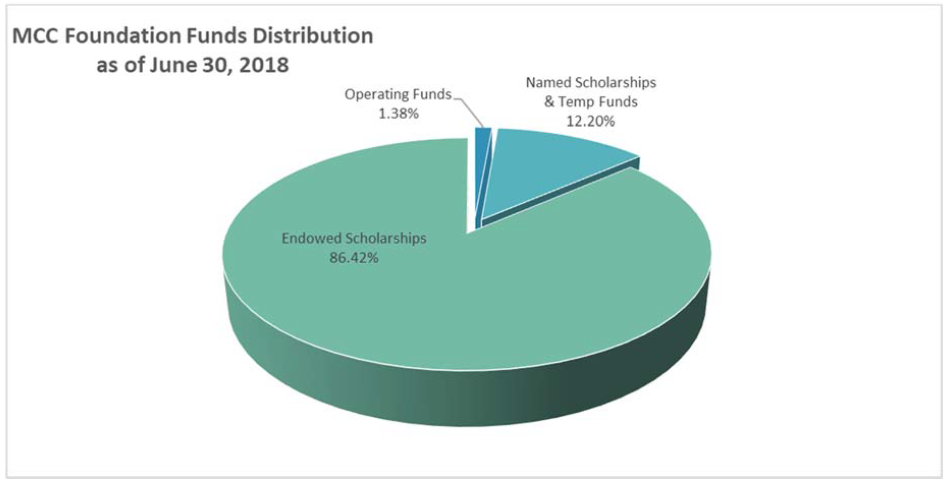
ABOUT MCC FOUNDATION
In 1995 the Montgomery Community College Foundation was reactivated as a 501(c)(3) non-profit with the mission of promoting and enhancing the quality of education at Montgomery Community College.
Montgomery Community College Foundation’s mission is to enable MCC students to further his/her education. The Foundation will solicit and carefully manage funds for scholarships, awards, equipment, books, and other purposes to enable and enrich the college experience for students.
The MCC Foundation manages 86 Endowed Scholarship Funds and 39 Named Scholarship Funds. In academic year 2018, 74 students were awarded scholarships from the interest and earnings of these 125 funds. The scholarships cover tuition, fees and for Montgomery Scholars, $250 toward books.
Montgomery Scholars Program Scholarship funds are designed to provide Montgomery County high school graduates with a two-year scholarship to MCC beginning the fall semester of their graduation. Twenty-one first year Montgomery Scholars scholarships were awarded in academic year 2018, and four second-year Montgomery Scholars scholarships were awarded.
A complete list of scholarships is available by request to the MCC Director of Resource Development.
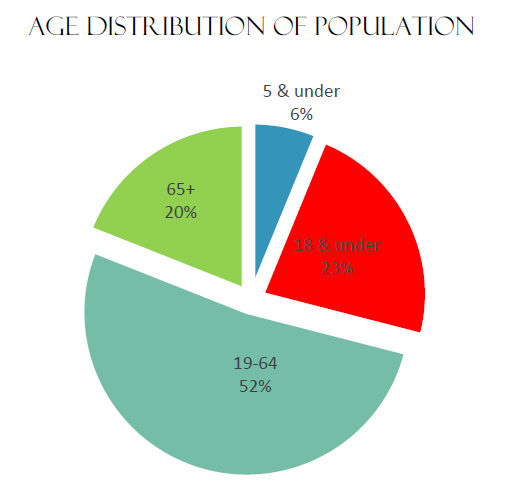
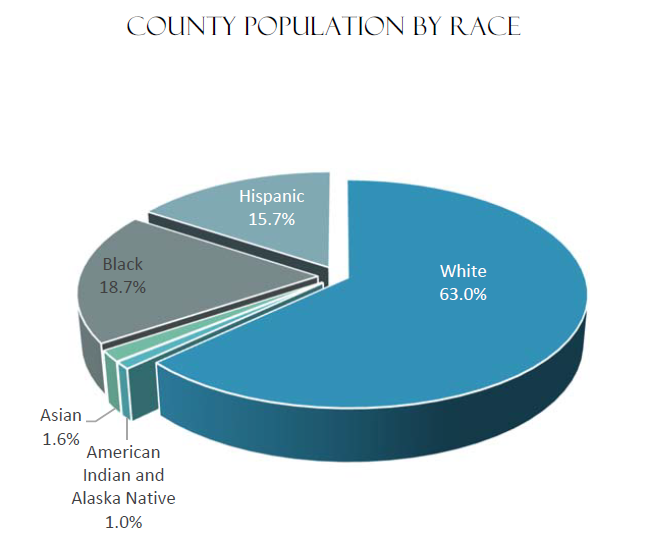
ABOUT MONTGOMERY COUNTY
LOCATION:
Geographic Region – Piedmont
Greensboro – 50 miles
Charlotte – 60 miles
Raleigh – 105 miles
RURAL
Land Area (sq. mi.) – 491
Elevation – 664 ft.
Largest town and county seat – Troy
Regional Partnership Workforce Development Board
Montgomery County Economic Development
CLIMATE:
Average annual high temperature – 71 ° F
Average annual low temperature – 49 ° F
Annual average rainfall – 47 inches
Annual average snowfall – 2 inches
TRANSPORTATION:
Highways
Interstate 73/74
NC 24/27
NC 109
NC 134
NC 73
AIR
Local Airport: Star
Commercial Airport: Piedmont Triad Airport, Greensboro (55 mi.)
Railroads (freight)
Aberdeen Carolina & Western Railway
Source: Montgomery County Economic Development
POPULATION:
| Population 2017 July Certified Estimation | 27,845 |
| Population 2010 | 27,798 |
| Population Density (Per sq. mi.) | 56 |
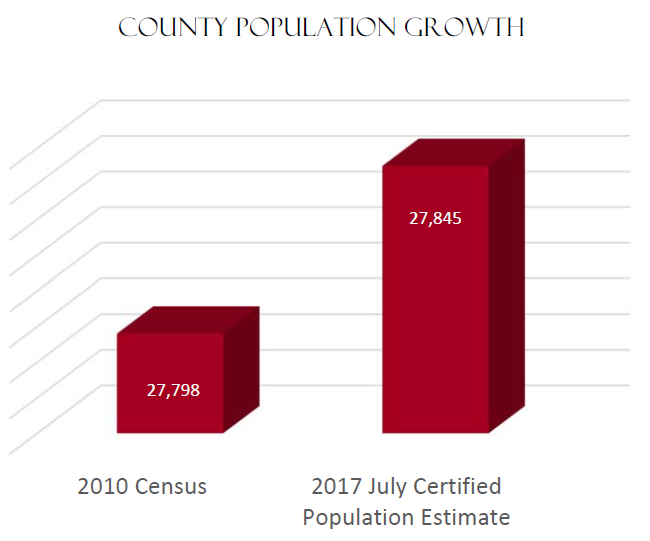
Source: MC Economic Development & US Census Bureau
Source: Quickfacts.census.gov
Source: Quickfacts.census.gov
INCOME AND POVERTY:
Median Household Income 2016 $48,113
Per Capita Income 2017 $33,662
Population in Poverty 2017 Est. 4,719
Poverty Rate 17.8%
Child Poverty Rate 30.3%
Elderly Poverty Rate 26%
HOUSING:
Home-ownership Rate (2017) 70%
Number of Households 10,855
Number of Housing Units 16,203
HEALTH:
2017 Number of Physicians 8
Percent Uninsured 15.4%
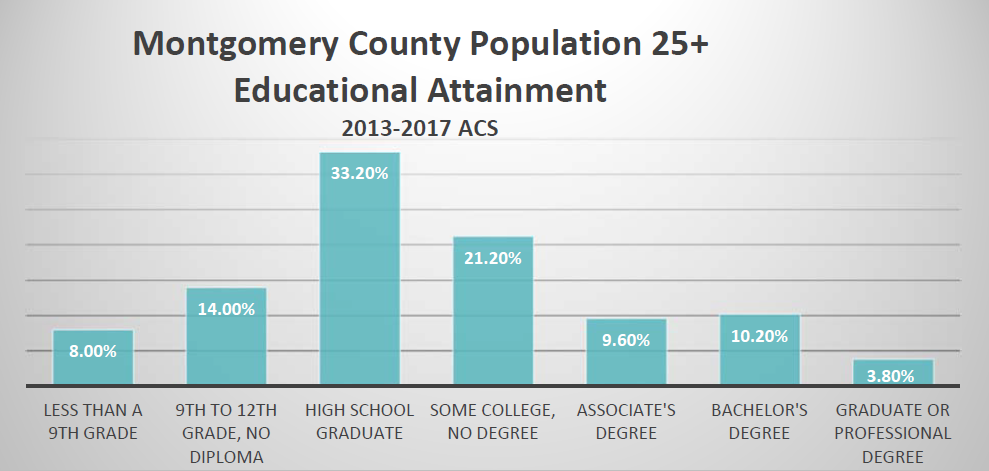
EDUCATION:
Graduation Rate (High School or higher) 77.9%
Per Student Expenditures K-12 (local funds) $1,349
Average SAT Score (2018) 996
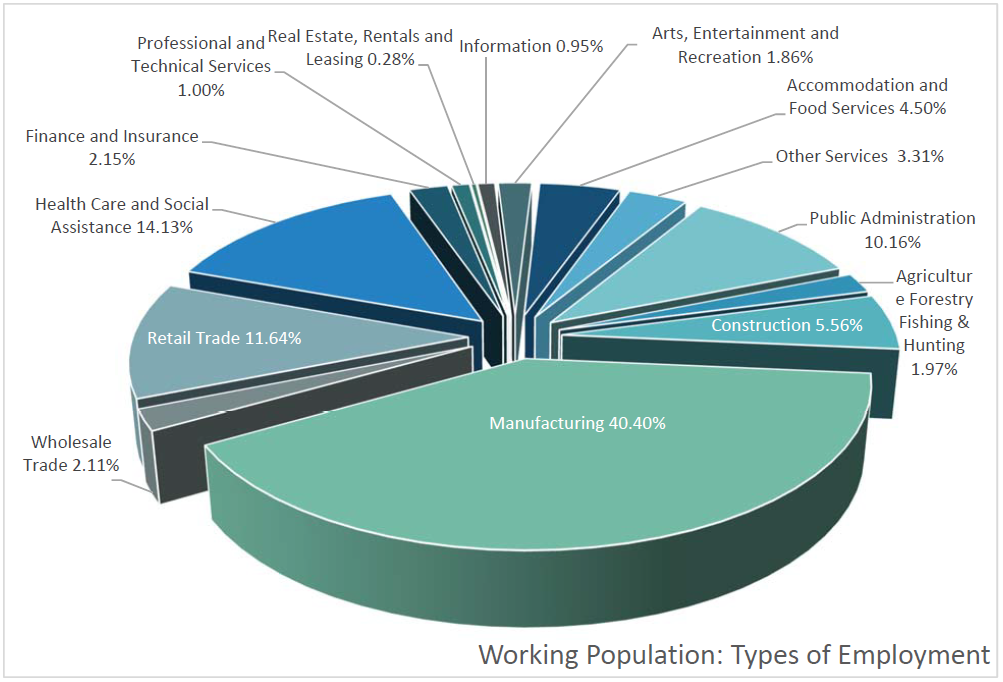
LABOR FORCE AND EMPLOYMENT:
Unemployment Rate 2018 3.8%
Percent Working Age Population 51.3%
Average Commute Time (minutes) 24
Percent Commuting to Another County 32.5%
Source: AccessNC.commerce.state
NATIONAL PROJECTIONS
SELECTED INFORMATION FROM THE BUREAU OF LABOR STATISTICS:
2016-2026 EMPLOYMENT PROJECTIONS ( OCT 2017)
The service-providing sectors are projected to add more than 10.5 million jobs to reach over 135.8 million jobs by 2026. This increase represents just over 91 percent of all jobs added from 2016 to 2026. Employment in the service-providing sectors is expected to grow by 0.8 percent annually from 2016 to 2026, which is slightly faster than the 0.7 percent growth in jobs for the entire economy. This growth is slower than the 0.9 percent annual growth that the sector experienced from 2006 to 2016. As with the last three sets of projections, the health care and social assistance sector is projected to have the most employment growth. The sector is expected to increase by almost 4 million jobs and is expected to reach over 23 million jobs by 2026. Employment in the health care and social assistance sector is projected to grow at a 1.9 percent annual rate, which is more than twice as fast as the overall annual growth of jobs in the entire economy. This growth rate is below the 2.3 percent annual growth rate that took place during the 2006–16 decade for the health care and social assistance sector.
Employment in the goods-producing sectors excluding agriculture is projected to increase by 219,000 jobs over the 2016–26 decade. This growth contrasts with the loss of almost 2.8 million jobs over the previous decade. Manufacturing, the largest sector in this group, is projected to have the largest decrease in jobs over the 2016–26 projections decade, declining by 736,400 jobs. Although large, the loss is about 40 percent of that experienced from 2006 to 2016, which saw a decrease in more than 1.8 million manufacturing jobs.
Employment in the construction sector is expected to increase substantially, adding 864,700 jobs. This increase almost makes up for the 980,200 jobs that were lost during the 2006–16 decade, nearly bringing the construction sector back to its prerecession level.
Total employment in the agriculture, forestry, fishing, and hunting sector is expected to decline by 6,100 jobs from 2016 to 2026, a result of a decline of 23,000 in self-employment over the projections decade. This total decline is smaller for the sector than the expected loss of 110,500 jobs over the 2014–24 projections decade. This decline was largely a result of falling employment projected in the crop production industry. Total crop production industry employment was projected to decline 0.7 percent annually during the 2014–24 decade but is now expected to grow 0.2 percent annually over the 2016–26 projections decade. As farms are consolidating and getting larger, they are adopting precision agriculture technologies, leading to an increase in hired labor.
LABOR FORCE
The labor force in 2026 is expected to be much older and to become more diverse. The median age of the labor force is expected to rise slightly from 42.0 in 2016 to 42.3 in 2026—the highest level ever recorded.
The projected labor force annual growth of 0.6 percent in the 2016–26 decade is because of slow population growth. Changes in the age composition of the population and labor force participation rates of the different age, gender, and race and ethnic groups will also affect growth. The labor force will change in composition as various age, gender, and race and ethnic groups experience different rates of change. The shares of both the youth and the prime age groups in the labor force are projected to decline, whereas older workers will continue to increase their share to about one-quarter of the labor force by 2026. The 75-and-older group is projected to have the fastest growth, followed by the 65-to-74 year-olds.
Since 1996, labor force growth for men has been lagging that for women, and this trend is expected to continue over the 2016–26 decade. The women’s labor force is projected to have a 0.8 percent annual growth rate, whereas the men’s labor force is projected to grow 0.5 percent. Continuing its trend from the past couple of decades, women’s share of the labor force is projected to increase, and the men’s share is projected to decrease.
Over the 2016–26 decade, the U.S. labor force is expected to become more diverse. Because immigration is the main engine of population growth, the projected high labor force participation rates for Asian and Hispanic immigrants will increase the share of minorities more in the coming decade than previously. The participation rate of white non-Hispanics, who have always accounted for the largest share, is projected to decline.
The changing composition of the labor force among the different age, gender, and race and ethnic groups creates a dynamic that shows the movement of these different groups into and out of the labor force. This dynamic of labor force change emerges from three groups:
• Entrants: those who will be in the labor force in 2026 but who were not in it in 2016
• Leavers: those who were in the labor force in 2016 but who will exit before 2026
• Stayers: those who were in the labor force in 2016 and who will remain through 2026
Thus, the projected labor force of 2026 may be regarded as consisting of the labor force of 2016, plus the entrants and minus the leavers. BLS projects that between 2016 and 2026, nearly 39 million workers will enter the labor force and 28 million will leave. Leavers are more likely to be men, because the labor force has more older men than older women.
Fastest Growing Occupations, 2016 and Projected 2026
(Numbers in thousands)
| 2016 National Employment Matrix title and code | Employment | Change, 2016-26 | Median annual wage, 2016(1) | |||
| 2016 | 2026 | Number | Percent | |||
| Total, all occupations | 00-0000 | 156,063.8 | 167,582.3 | 11,518.6 | 7.4 | $37,040 |
| Solar photovoltaic installers | 47-2231 | 11.3 | 23.2 | 11.9 | 105.3 | $39,240 |
| Wind turbine service technicians | 49-9081 | 5.8 | 11.3 | 5.5 | 96.1 | $52,260 |
| Home health aides | 31-1011 | 911.5 | 1,337.0 | 425.6 | 46.7 | $22,600 |
| Personal care aides | 39-9021 | 2,016.1 | 2,770.1 | 754.0 | 37.4 | $21,920 |
| Physician assistants | 29-1071 | 106.2 | 145.9 | 39.7 | 37.4 | $101,480 |
| Nurse practitioners | 29-1171 | 155.5 | 211.5 | 56.0 | 36.0 | $100,910 |
| Statisticians | 15-2041 | 37.2 | 49.6 | 12.4 | 33.4 | $80,500 |
| Physical therapist assistants | 31-2021 | 88.3 | 115.5 | 27.2 | 30.8 | $56,610 |
| Software developers, applications | 15-1132 | 831.3 | 1,084.6 | 253.4 | 30.5 | $100,080 |
| Mathematicians | 15-2021 | 3.1 | 4.0 | 0.9 | 29.4 | $105,810 |
| Bicycle repairers | 49-3091 | 12.4 | 16.1 | 3.7 | 29.4 | $27,630 |
| Medical assistants | 31-9092 | 634.4 | 819.0 | 184.6 | 29.1 | $31,540 |
| Physical therapist aides | 31-2022 | 52.0 | 67.1 | 15.1 | 29.1 | $25,680 |
| Occupational therapy assistants | 31-2011 | 39.3 | 50.7 | 11.4 | 28.9 | $59,010 |
| Information security analysts | 15-1122 | 100.0 | 128.5 | 28.4 | 28.4 | $92,600 |
| Genetic counselors | 29-9092 | 3.1 | 3.9 | 0.9 | 28.3 | $74,120 |
| Operations research analysts | 15-2031 | 114.0 | 145.3 | 31.3 | 27.4 | $79,200 |
| Forest fire inspectors and prevention specialists | 33-2022 | 1.7 | 2.2 | 0.5 | 26.6 | $36,230 |
| Health specialties teachers, postsecondary | 25-1071 | 233.5 | 294.0 | 60.5 | 25.9 | $99,360 |
| Derrick operators, oil and gas | 47-5011 | 11.1 | 13.9 | 2.8 | 25.7 | $48,130 |
| Physical therapists | 29-1123 | 239.8 | 299.8 | 60.0 | 25.0 | $85,400 |
| Occupational therapy aides | 31-2012 | 7.5 | 9.3 | 1.8 | 24.7 | $28,330 |
| Roustabouts, oil and gas | 47-5071 | 50.0 | 62.3 | 12.2 | 24.5 | $37,340 |
| Phlebotomists | 31-9097 | 122.7 | 152.6 | 30.0 | 24.4 | $32,710 |
| Rotary drill operators, oil and gas | 47-5012 | 16.7 | 20.8 | 4.0 | 24.2 | $54,430 |
| Nursing instructors and teachers, postsecondary | 25-1072 | 67.9 | 84.2 | 16.3 | 24.0 | $69,130 |
| Massage therapists | 31-9011 | 160.3 | 198.1 | 37.7 | 23.5 | $39,860 |
| Service unit operators, oil, gas, and mining | 47-5013 | 41.4 | 51.1 | 9.7 | 23.4 | $48,610 |
| Respiratory therapists | 29-1126 | 130.2 | 160.6 | 30.4 | 23.4 | $58,670 |
| Diagnostic medical sonographers | 29-2032 | 67.3 | 82.9 | 15.6 | 23.2 | $69,650 |
| Footnotes: | ||||||
| (1) Data are from the Occupational Employment Statistics program, U.S. Bureau of Labor Statistics. Wage data cover non-farm wag | ||||||
| Source: Employment Projections program, U.S. Bureau of Labor Statistics |
OCCUPATIONS WITH MOST JOB GROWTH, 2016 AND PROJECTED 2026
| 2016 National Employment Matrix title and code | Employment | Change, 2016-26 | Median annual wage, 2016(1) | |||
| 2016 | 2026 | Number | Percent | |||
| Total, all occupations | 00-0000 | 156,063.8 | 167,582.3 | 11,518.6 | 7.4 | $37,040 |
| Personal care aides | 39-9021 | 2,016.1 | 2,770.1 | 754.0 | 37.4 | $21,920 |
| Combined food preparation and serving workers, including fast food | 35-3021 | 3,452.2 | 4,032.1 | 579.9 | 16.8 | $19,440 |
| Registered nurses | 29-1141 | 2,955.2 | 3,392.2 | 437.0 | 14.8 | $68,450 |
| Home health aides | 31-1011 | 911.5 | 1,337.0 | 425.6 | 46.7 | $22,600 |
| Software developers, applications | 15-1132 | 831.3 | 1,084.6 | 253.4 | 30.5 | $100,080 |
| Janitors and cleaners, except maids and housekeeping cleaners | 37-2011 | 2,384.6 | 2,617.7 | 233.0 | 9.8 | $24,190 |
| General and operations managers | 11-1021 | 2,263.1 | 2,469.0 | 205.9 | 9.1 | $99,310 |
| Laborers and freight, stock, and material movers, hand | 53-7062 | 2,628.4 | 2,829.2 | 200.8 | 7.6 | $25,980 |
| Medical assistants | 31-9092 | 634.4 | 819.0 | 184.6 | 29.1 | $31,540 |
| Waiters and waitresses | 35-3031 | 2,600.5 | 2,783.0 | 182.5 | 7.0 | $19,990 |
| Nursing assistants | 31-1014 | 1,510.3 | 1,674.4 | 164.0 | 10.9 | $26,590 |
| Construction laborers | 47-2061 | 1,216.7 | 1,370.0 | 153.3 | 12.6 | $33,430 |
| Cooks, restaurant | 35-2014 | 1,231.9 | 1,377.2 | 145.3 | 11.8 | $24,140 |
| Accountants and auditors | 13-2011 | 1,397.7 | 1,538.0 | 140.3 | 10.0 | $68,150 |
| Customer service representatives | 43-4051 | 2,784.5 | 2,920.5 | 136.0 | 4.9 | $32,300 |
| Market research analysts and marketing specialists | 13-1161 | 595.4 | 731.4 | 136.0 | 22.8 | $62,560 |
| Medical secretaries | 43-6013 | 574.2 | 703.2 | 129.1 | 22.5 | $33,730 |
| Landscaping and groundskeeping workers | 37-3011 | 1,197.9 | 1,321.2 | 123.3 | 10.3 | $26,320 |
| Heavy and tractor-trailer truck drivers | 53-3032 | 1,871.7 | 1,985.5 | 113.8 | 6.1 | $41,340 |
| Maintenance and repair workers, general | 49-9071 | 1,432.6 | 1,545.3 | 112.7 | 7.9 | $36,940 |
| Teacher assistants | 25-9041 | 1,308.1 | 1,417.6 | 109.5 | 8.4 | $25,410 |
| Financial managers | 11-3031 | 580.4 | 688.8 | 108.4 | 18.7 | $121,750 |
| Elementary school teachers, except special education | 25-2021 | 1,410.9 | 1,514.9 | 104.1 | 7.4 | $55,800 |
| Stock clerks and order fillers | 43-5081 | 2,008.6 | 2,109.9 | 101.3 | 5.0 | $23,840 |
| Management analysts | 13-1111 | 806.4 | 902.8 | 96.5 | 12.0 | $81,330 |
| Receptionists and information clerks | 43-4171 | 1,053.7 | 1,149.4 | 95.7 | 9.1 | $27,920 |
| Sales representatives, services, all other | 41-3099 | 983.0 | 1,077.2 | 94.2 | 9.6 | $52,490 |
| Teachers and instructors, all other | 25-3099 | 993.9 | 1,086.4 | 92.5 | 9.3 | $30,110 |
| Business operations specialists, all other | 13-1199 | 1,023.9 | 1,114.1 | 90.2 | 8.8 | $69,040 |
| Licensed practical and licensed vocational nurses | 29-2061 | 724.5 | 813.1 | 88.6 | 12.2 | $44,090 |
| Footnotes: | ||||||
| (1) Data are from the Occupational Employment Statistics program, U.S. Bureau of Labor Statistics. Wage data cover non-farm wage and salary workers and do not cover the self-employed, owners and partners in unincorporated firms, or household workers. | ||||||
| Source: Employment Projections program, U.S. Bureau of Labor Statistics |
INDUSTRIES WITH THE FASTEST GROWING AND MOST RAPIDLY DECLINING WAGE AND SALARY EMPLOYMENT
| Industry Description | Thousands of Jobs | Change | Compound Annual Rate of Change | |
| 2016 | 2026 | 2016-26 | 2016-26 | |
| Fastest Growing | ||||
| Home health care services | 1,362.0 | 2,100.2 | 738.2 | 4.4 |
| Other information services | 259.3 | 384.7 | 125.4 | 4.0 |
| Individual and family services | 2,229.4 | 3,100.8 | 871.4 | 3.4 |
| Outpatient care centers | 856.3 | 1,178.9 | 322.6 | 3.2 |
| Offices of other health practitioners | 858.5 | 1,122.5 | 264.0 | 2.7 |
| Medical and diagnostic laboratories | 262.8 | 334.9 | 72.1 | 2.5 |
| Other ambulatory health care services | 288.6 | 365.0 | 76.4 | 2.4 |
| Support activities for mining | 265.0 | 334.3 | 69.3 | 2.4 |
| Other personal services | 320.2 | 401.5 | 81.3 | 2.3 |
| Management, scientific, and technical consulting services | 1,372.5 | 1,691.5 | 319.0 | 2.1 |
| Office administrative services | 495.1 | 608.4 | 113.3 | 2.1 |
| Offices of physicians | 2,527.7 | 3,076.5 | 548.8 | 2.0 |
| Warehousing and storage | 915.1 | 1,110.8 | 195.7 | 2.0 |
| Computer systems design and related services | 1,990.7 | 2,415.7 | 425.0 | 2.0 |
| Software publishers | 355.6 | 425.5 | 69.9 | 1.8 |
| Offices of dentists | 925.8 | 1,101.2 | 175.4 | 1.8 |
| Oil and gas extraction | 180.0 | 214.0 | 34.0 | 1.7 |
| Other educational services | 730.3 | 867.4 | 137.1 | 1.7 |
| Local government passenger transit | 284.1 | 332.3 | 48.2 | 1.6 |
| Museums, historical sites, and similar institutions | 159.7 | 185.9 | 26.2 | 1.5 |
| Most Rapidly Declining | ||||
| Tobacco manufacturing | 12.9 | 8.0 | -4.9 | -4.7 |
| Federal electric utilities | 15.5 | 10.8 | -4.7 | -3.5 |
| Apparel, leather and allied product manufacturing | 160.8 | 112.6 | -48.2 | -3.5 |
| Communications equipment manufacturing | 85.6 | 61.9 | -23.7 | -3.2 |
| Newspaper, periodical, book, and directory publishers | 374.4 | 286.4 | -88.0 | -2.6 |
| Manufacturing and reproducing magnetic and optical media | 15.4 | 11.9 | -3.5 | -2.6 |
| Cable and other subscription programming | 52.8 | 40.9 | -11.9 | -2.5 |
| Logging | 51.2 | 40.3 | -10.9 | -2.4 |
| Foundries | 117.5 | 92.4 | -25.1 | -2.4 |
| Pulp, paper, and paperboard mills | 100.0 | 79.2 | -20.8 | -2.3 |
| Textile mills and textile product mills | 228.9 | 184.7 | -44.2 | -2.1 |
| Other chemical product and preparation manufacturing | 80.2 | 65.8 | -14.4 | -2.0 |
| Wired telecommunications carriers | 588.5 | 486.0 | -102.5 | -1.9 |
| Satellite, telecommunications resellers, and all other telecommunications | 85.3 | 70.5 | -14.8 | -1.9 |
| Printing and related support activities | 446.7 | 373.5 | -73.2 | -1.8 |
| Rubber product manufacturing | 133.1 | 111.6 | -21.5 | -1.7 |
| Iron and steel mills and ferroalloy manufacturing | 83.6 | 70.6 | -13.0 | -1.7 |
| Spring and wire product manufacturing | 43.0 | 36.5 | -6.5 | -1.6 |
| Computer and peripheral equipment manufacturing, excluding digital camera manufacturing | 164.1 | 141.0 | -23.1 | -1.5 |
| Industrial machinery manufacturing | 113.6 | 97.8 | -15.8 | -1.5 |
| Source: Employment Projections program, U.S. Bureau of Labor Statistics |
GLOSSARY
Academic Semester — A sixteen-week period during which credit classes are offered.
Academic Year — The academic year includes fall and spring semesters as well as an eleven-week summer term.
Accreditation — A formal means of recognizing an institution for maintaining standards that qualify the graduates for admission to higher institutions or for professional practice. Accrediting agencies are responsible for establishing the standards and evaluating the schools’ compliance with them (e.g. Southern Association of Colleges and Schools, American Dental Association, Engineering).
Accountability — The acceptance of personal responsibility for the achievement of predetermined measurable objectives.
Adult Basic Education (ABE) — A program of basic skills for adults, 16 years of age or older and out of school, who function at less than a high school level.
Adult Education — Programs that provide opportunities for adults and out-of-school youth to further their education.
Affirmative Action — The planned, aggressive, coherent, management program to provide for equal employment opportunity. It is a results-oriented program designed to achieve equal employment opportunity rather than simply a policy to assure nondiscrimination. As an ongoing management program, it requires periodic evaluation.
Appropriation — The act by which the legislature provides the state dollars for the operation of an institution. Funds are appropriated to the State Board of Community Colleges to be distributed to the institutions.
Associate in Applied Science Programs (AAS) — These programs range from 64 to 76 semester hour credits. A full-time student can typically complete one of these programs within two years. In addition to major course work, associate in applied science degree programs require a minimum of 15 semester hour credits of general education. General education requirements include course work in communications, humanities/fine arts, social/behavioral sciences and natural sciences/mathematics. Certain courses in associate degree programs may be accepted by a four-year college or university for transfer credit in an associated field.
Base Budget — Appropriations made by the Legislature to fund the current level of operation.
Capital Outlay — Capital outlay expenditures are those that result in the acquisition of fixed assets or additions to fixed assets (i.e. expenditures for land, buildings, or equipment).
Categorical Funds (restricted) — Funds from a federal, state, local, or private source that are restricted to expenditures in a particular category or program.
Certificate Programs — These programs range from 12 to 18 semester hour credits and can usually be completed within one semester by a full-time student. Associate degree level courses within a certificate program may also be applied toward a diploma or an associate in applied science degree.
Certification — A voluntary form of recognition for knowledge and skill in a particular profession.
Clock Hour — One hour of instruction given one student. Class periods from 50–60 minutes may be counted as one clock hour depending on the type of instruction delivered.
College Transfer Programs — These programs are offered through the Associate in Arts (AA), Associate in Fine Arts (AFA) and Associate in Science (AS) degrees. The Associate in Arts and the Associate in Science programs are part of the Comprehensive Articulation Agreement (CAA). This agreement addresses the transfer of students between institutions in the North Carolina Community College System and the constituent institutions of the University of North Carolina.
Compensatory Education — A special state-funded educational program for mentally retarded adults (over 17 years of age).
Competency-Based Instruction — Instruction based on measurable student performance outcomes consistent with the skills and knowledge needed by entry-level employees in a particular field.
Cooperative Skills Training — A training program specifically designed to provide customized training for existing industry. This training can be provided on campus or at the industrial site.
Credit Hour — An instructional unit used for recognition of the amount of credit a student earns for a given course. Example: Semester Credit Hour—A student who spends one classroom hour per week in a class for sixteen weeks earns one semester hour credit.
Current Expense — Funds used for the general operation of the institution to include salaries, benefits, and other instructional costs.
Curriculum Programs — A term used to describe a wide variety of planned educational programs which range in length from one semester to two years. These programs lead to certificates, diplomas or associate degrees, depending on the nature of the curriculum. Curriculum programs include certificate, diploma,
Associate in Applied Science, Associate in Arts, Associate in Fine Arts, Associate in Science and Associate in General Education programs.
Developmental Education — A program providing specialized credit courses for students who need to improve their basic skill in order to perform at the level required for admission to degree and diploma programs. Usually these courses are in reading, writing, and mathematics.
Diploma Programs — These programs range from 36 to 48 semester hour credits and can usually be completed by a full-time student within two semesters and one summer term. Associate degree level courses within a diploma program may also be applied toward an Associate in Applied Science degree.
English as a Second Language (ESL) — A program of instruction to help adults with limited or no English language proficiency.
Expansion Budget — Additional funds from the legislature to increase the quantity or quality of services rendered.
Fiscal Year — The twelve-month period upon which the institution’s budget is based, July1–June 30.
Full-Time Equivalent (FTE) — One full-time equivalent (FTE) student represents 16 student membership hours per week for 16 weeks or 256 student membership hours for each semester enrolled.
• Annual Curriculum FTE — The total of fall and spring FTE.
• Annual Extension FTE — The total of spring, summer and fall sequenced periods FTE.
• Budget Full-Time Equivalent (B/FTE) — Used to prepare the operating budget and to provide for an equitable distribution of the operating funds allocated by the State Board to the institutions.
• Equipment Full-Time Equivalent (E/FTE) — Used to prepare the equipment budget and to provide for an equitable distribution of the equipment funds allocated by the State Board to the institutions.
• Library Full-Time Equivalent (L/FTE) — Used to prepare the library budget to provide for an equitable distribution of library funds allocated for the purchase of library books and audiovisual materials.
• Credit Hour Full-Time Equivalent (H/FTE) — Used in furnishing data to the North Carolina Commission on Higher Education Facilities and the University of North Carolina.
• Construction Full-Time Equivalent (C/FTE) — Used to determine priorities and institutional eligibility for federal and state construction funds for the institutions.
Full-Time Students — A student is considered full time if he/she carries 12 or more semester credit hours of classes.
General Educational Development (GED) — A high school equivalency program enabling adults to take the General Education Development Tests to determine if they are at the 12th grade completion level of English, social studies, science, reading, and math. Individuals achieving the required scores on the GED are awarded the High School Equivalency Diploma. The program is open to individuals 18 years or older.
General Education Programs — These programs are designed for individuals wishing to broaden their education, with emphasis on personal interest, growth and development. The two-year General Education program provides students opportunities to study English, literature, fine arts, philosophy, social science, science and mathematics at the college level. All courses in the program are college-level courses. Many of the courses are equivalent to college transfer courses; however, the program is not principally designed for college transfer. Successful completion of 64-65 semester hour credits leads to an associate in general education degree (AGE).
Human Resource Development (HRD) — A program with prevocational training and counseling for chronically unemployed adults.
Non-Credit (Extension) Courses — Courses for professional training, upgrading or general interest.
Occupational Education — Any type of instruction or training (credit or non-credit) that prepares one to enter an occupation.
Other Costs — A term used to describe current instructional and operating instructional support costs excluding personnel and the associated fringe benefits. The term is used for supplies, travel, postage, etc.
Pell Grants — Needs-based federally funded grants.
Transitional — Programs that do not lead to a formal award. They include special credit, Huskins Bill, high school, and dual enrolled high school programs.
Unduplicated Headcount — The total number of students (both full-time and part-time) enrolled in all courses during a year. Each student is counted only once during the year regardless of the number of classes he/she takes or the number of semesters for which he/she registers.
Source: A Matter of Facts, NC Community College Fact Book, 2008